Marketing Analytics
Inkblot Analytics has the capabilities to deliver best-in-class marketing analytics. But in addition to having premiere data scientists, we also have Ph.D. level social scientists. This allows us to inject customer psychographics in our analytics to create more accurate models of market behavior.

Bringing Customer Psychographics Into Your Marketing Analytics
Most companies believe they do this by using customer purchase history or customer demographics. But there's so much more to a person's psychological profile that past purchase behavior. If you can access it, these kind of psychographics can help you to strategically drive growth.
Using Psychological Traits Like "Creative Appreciation" in your Marketing Mix Model
Some marketing mix models (MMM) incorporate predictors like creative fatigue. So why not go one step further and measure how consumers receive and respond to creative. Get our free white paper on how you can better understand budget allocation by channel if you control for audience psychographics, such as creative appreciation.
Our Team Draws From All The Sciences

Data Science
Our team can use some of the most sophisticated algorithms available to help you simulate the best strategies for growth.

Psychological Science
Our team has members who have their Ph.D. and M.S. in psychology--helping us turn our marketing analytics practice into an innovation center by incorporating psychographics.

Computer Science
Our team can build and integrate with some of the most complex data infrastructures of the most tech savvy organizations.
Near-Real Time Dashboards For Every Use Case
Need your data visualized and your insights accessible to your team? Our templetized dashboards allow you to get complex analytics up and running in a short period of time. The best part? Our dashboards can be customized to include other features and metrics important to you.
ABOUT:
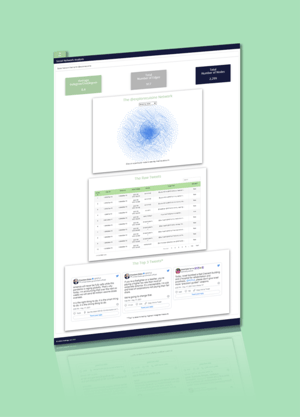
THIS DASHBOARD INCLUDES:
- A graph that shows connections between followers, posts, or hashtags
- Metrics that help the user understand when content is about to go viral
- The ability to segment/cluster your audience to cater towards their content needs records of past campaign spending by marketing channel
ABOUT:
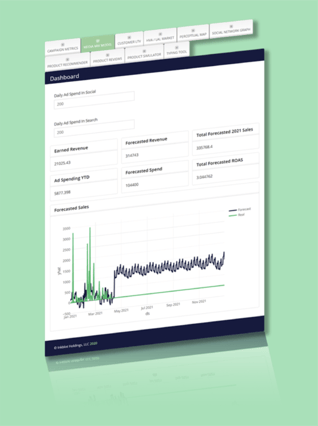
THIS DASHBOARD INCLUDES:
- A records of past campaign spending by marketing channel
- A forecast of how much should be spent on marketing over the remainder of the year
- The ability to identify which campaign and/or marketing channel is the biggest driver of sales
ABOUT:
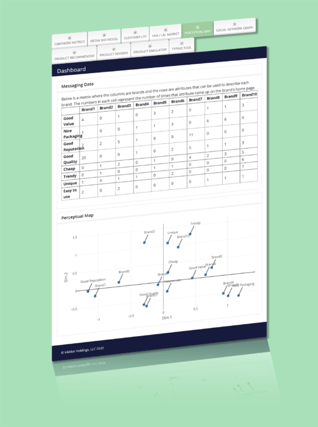
THIS DASHBOARD INCLUDES:
- A map that shows what brands are associated with what attributes
- The ability to simulate how the map would change if messaging changed
- The ability to overlay preference data to see what is the biggest driver of purchasing
ABOUT:
THIS DASHBOARD INCLUDES:
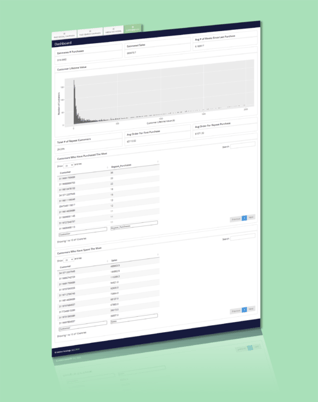
- An estimated probability or likelihood that each customer will purchase within the next month
- An estimated amount (in dollars) that each customer will spend on their next purchase
- Emails of top customers (by spend and by frequency)
ABOUT:
THIS DASHBOARD INCLUDES:
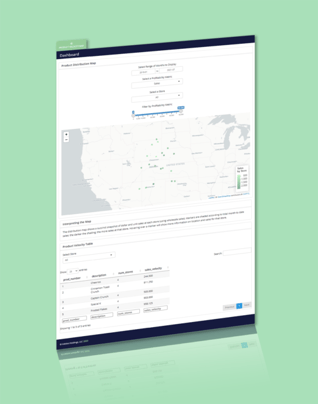
- The map to visualize metrics like product velocity across zip codes, counties, states, or regions
- The ability to help users search and identify the specific data by stores or geo-based metrics
- Recommendations of stores and products by shifting to a geo-based strategy
ABOUT:
THIS DASHBOARD INCLUDES:
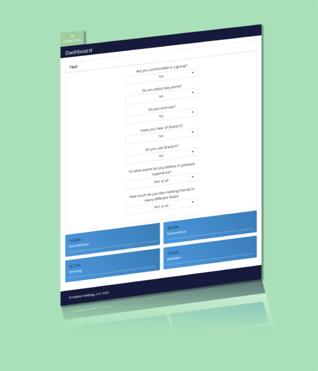
- The ability to type individual responses and see the probability that they are in each segment
- The ability to upload a dataset and have the whole dataset scored/typed
- Easy visualization of segmentation solution
ABOUT:
THIS DASHBOARD INCLUDES:
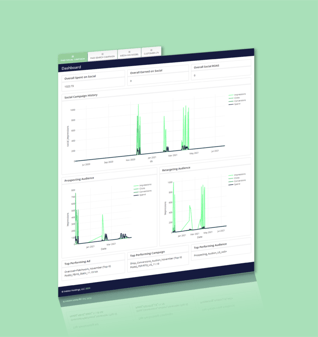
- A graph that shows connections between followers, posts, or hashtags
- Metrics that help the user understand when content is about to go viral
- The ability to segment/cluster your audience to cater towards their content needs
ABOUT:
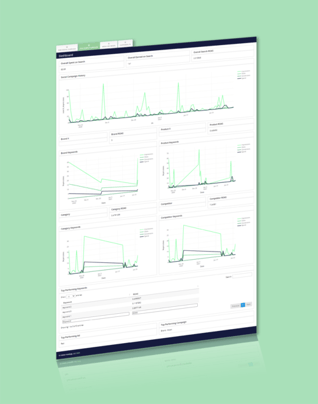
For daily reporting on your search performance activity, what’s being looked up, and how to keep getting hits
THIS DASHBOARD INCLUDES:
- A graph that shows connections search terms and page activity
- Metrics that help the user understand when searches terms are about to go viral
- The ability to segment/cluster your audience to cater towards their research needs
ABOUT:
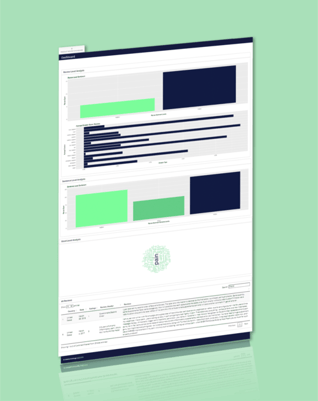
For reporting on what people are saying about your products, and understanding what’s driving positive/negative reviews
THIS DASHBOARD INCLUDES:
- An overview of positive and negative sentiment across reviews
- Specific topics of reviews and their relative frequency
- An analysis of what words/phrases are associated with higher scored reviews
ABOUT:
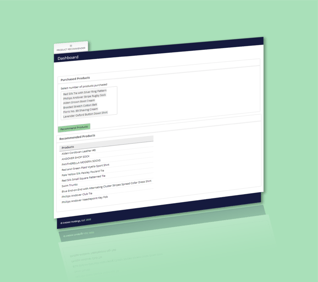
For reporting on how products are purchased together, and how to serve products in a way that maximizes revenue
THIS DASHBOARD INCLUDES:
- An analysis of what products are purchased together.
- A simulator to show what product should be recommended to a customer with a certain purchase history
- The ability to show what product bundles maximize revenue
ABOUT:
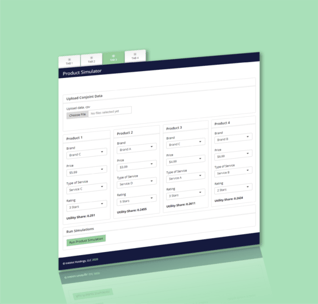
For simulating the next best improvement to a product that maximizes market share and revenue
THIS DASHBOARD INCLUDES:
- An analysis of what attributes and levels are the biggest drivers of purchase decisions
- A simulator that allows you to build a product and estimate market share
- The ability to look at price sensitivity across all attributes and levels
ABOUT:
For reporting on the biggest areas for growth or sales.
THIS DASHBOARD INCLUDES:
- The ability to visualize key metrics across zip codes, counties, states, or regions
- The ability to employ statistics that find trends in geographic data
- Recommendations on how to maximize sales by shifting to a geo-based strategy
![]()
Stay Up-To-Date On Psychological Insights In Marketing Analytics
Subscribe today to hear about our new developments in psych in marketing analytics and how it can help you drive business growth.
