INKBLOT AFFINITY
See Inkblot Affinity
in action
A guided walkthrough of the Affinity platform — from customer satisfaction dashboards to product-level drivers and verbatim feedback.
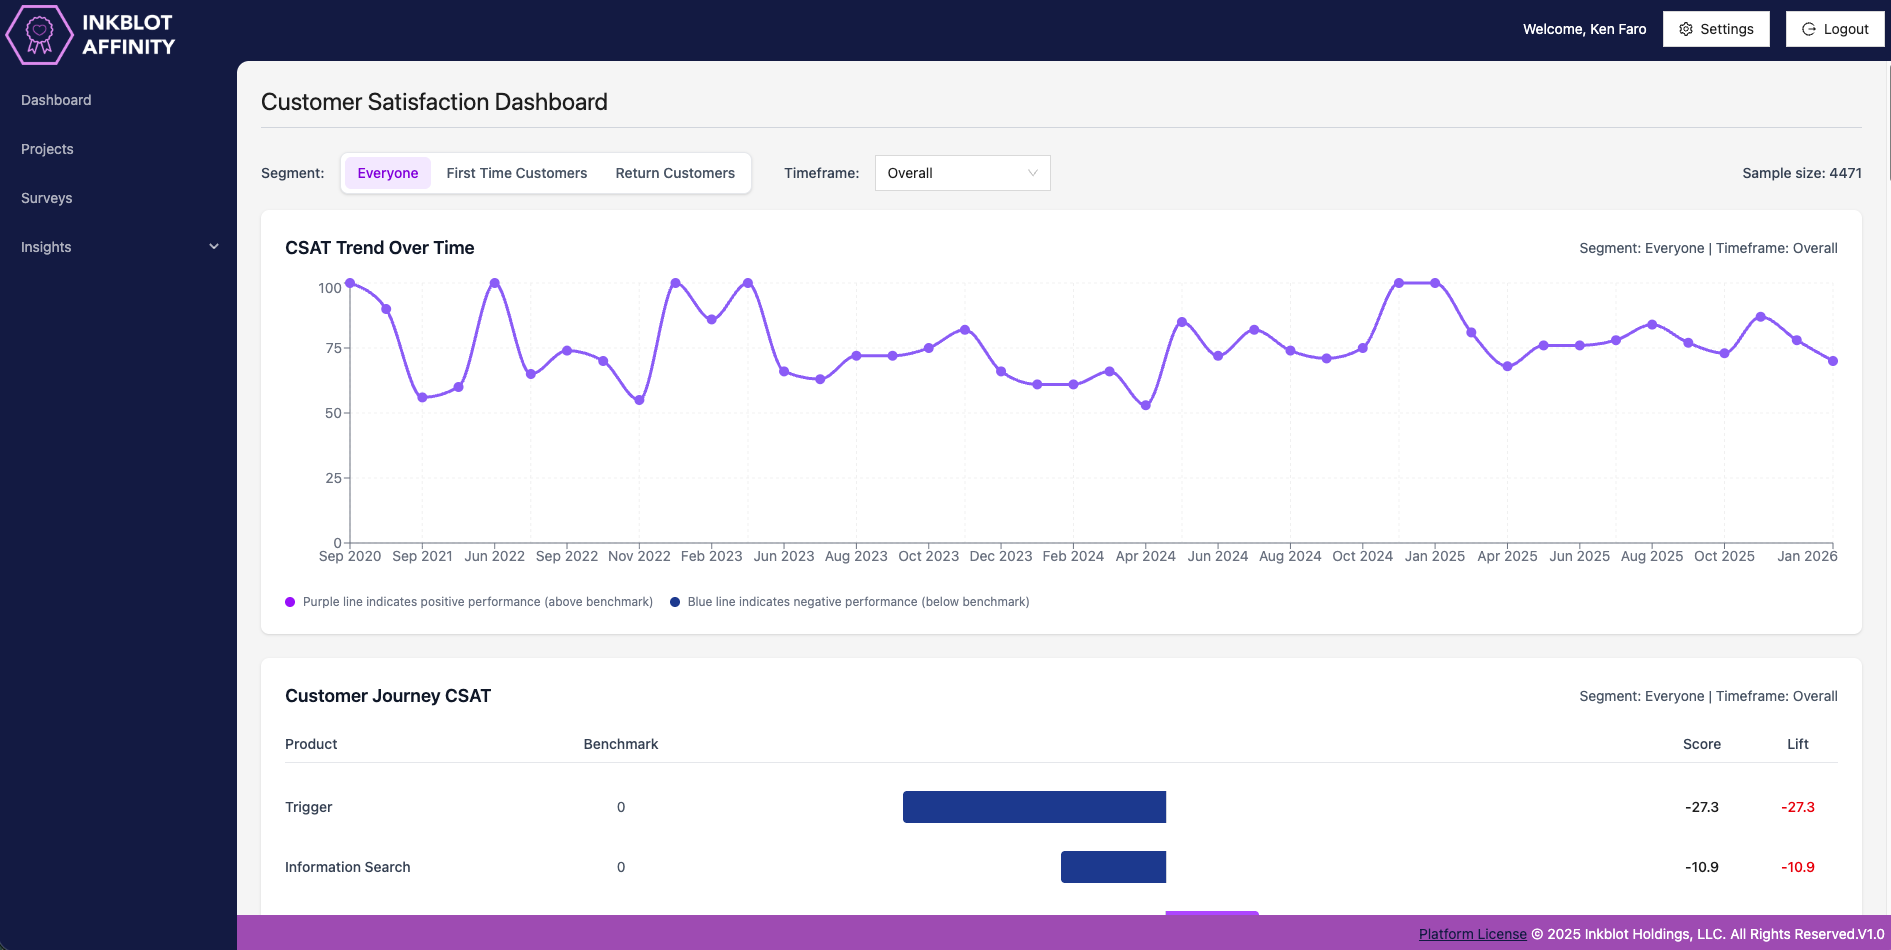
What you'll see in the demo
Six views across the Inkblot Affinity platform — built for CPG and consumer brands.
1
Segment & timeframe filters
Use our pre-built filters to switch between audiences or timeframe. This way, you can instantly re-cut the entire dashboard to dig for insights.
2
Lift scores at a glance
The Lift column shows you how certain scores land above or below industry or company benchmark. Red means underperforming; green means exceeding expectations.
3
Your top performers
This dashboard will show you every product in your portfolio ranked by CSAT score. Get real time updates on how products are increasing to decreasing in product satisfaction.
4
The 'why' behind every score
The Reason column surfaces the specific driver — price, fit, ease of use, advertising match — behind each product's satisfaction score.
5
Customers in their own words
Our dashboard groups open-ended responses into what customers love about your products, their experienced pain points, and any suggested improvements.
6
80 / 20 loyalty split
The summary card gives you an instant read: 80% of customers will repurchase, 20% won't return. Use this to set retention KPIs and flag at-risk product lines.
Ready to run this on your brand?
Talk to the Inkblot team about setting up Affinity for your product portfolio.
Book a Call